The salary survey originated in 2015 in the Russian-speaking community and has been conducted every December for 5 years so far. You are welcome to explore the survey results' analytics in the articles from previous years. Here you can find some analytics based on collected survey responses from December 2019 as well as their comparison with the previous surveys' data.
Thanks to everyone who filled out the salary survey form in 2019.
In 2019 the number of respondents who participated in the salary survey has grown by 35% compared to 2018 and amounted to 950. Starting from around 200 responses in 2015 the audience is increasing steadily by an average of 53% each year.
Since 2015, the median salary has grown by 5k every year, except for 2018, when it remained the same as in 2017. Fortunately, in 2019, growth by 5k resumed.
From here all the charts below are based on clean data, which contains only European respondents in IT positions (5.3% responses excluded).
This year there were slightly more women than in the last two years: 15.4% in 2019 compared to ~14% in 2017 and 2018.
Respondents come from 70 cities from 20 countries from Europe and Asia.
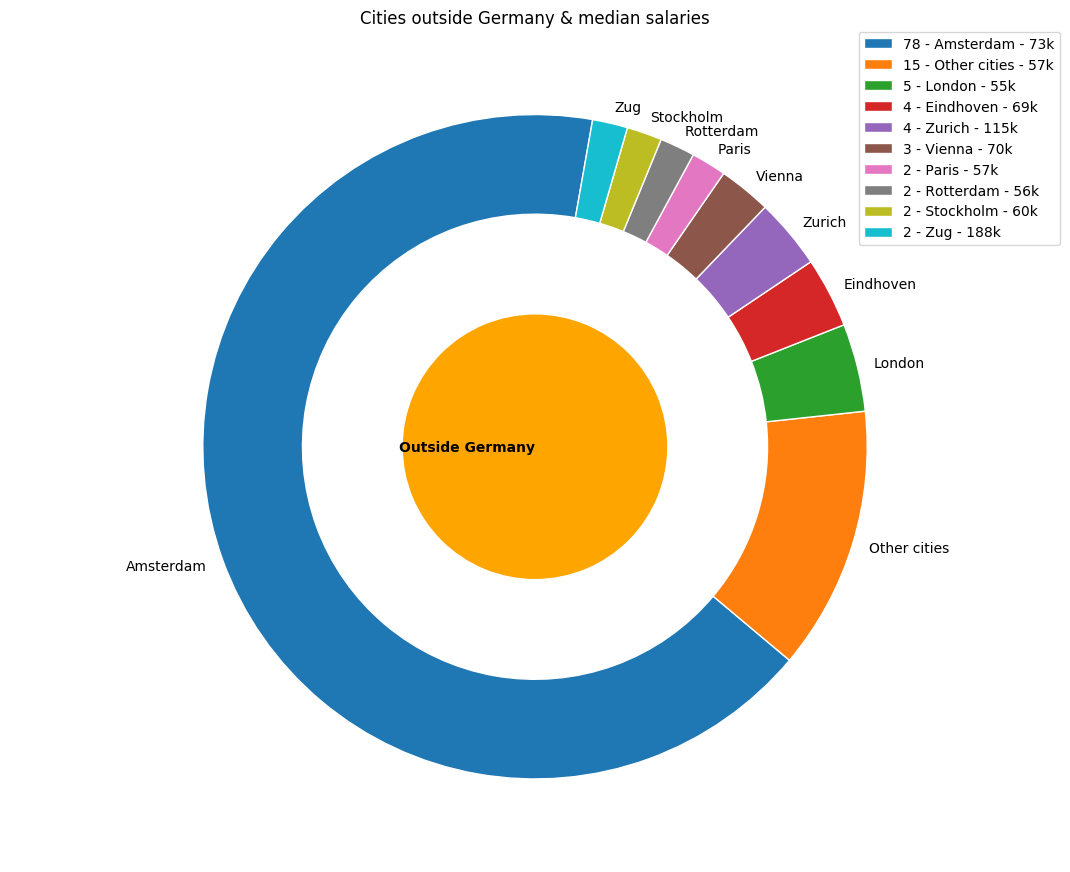 Amsterdam is the most represented city outside Germany with a median yearly salary equal to 73k. Among all cities, it is in the 3rd place by share of respondents (8%) after Berlin (45%) and Munich (25%).
"Other cities" category unites cities with at most one respondent from Western or North Europe.
 In Germany, Berlin and Munich remain the most represented cities with 70k and 72k median yearly Brutto salaries per year respectively.
 The inner pie chart shows shares of main languages at work among respondents. The outer donut chart contains popular countries, where the certain language speak. Thus, in Germany, employees speak German, English, and Russian.
In the consulting sector in Germany, employees speak mostly German, whereas in product companies and startups English is considered as the main language.
Most respondents have 30 vacation days a year.
A quarter of German respondents work as Backend Developer, their median salary with bonuses is 70k/year. Positions with less than 5 responses are not presented.
43 different job titles appear in the responses. The above scatter plot is built only based on Developer, Engineer (including ML), Data Scientist, and Architect positions (Dev&Tech) in Germany excluding Designers, Managers, QA, DevOps, and others.
Note that the scatter plot is based on Brutto salaries without bonuses and stocks. The median salary of all Dev&Tech positions is 70k, whereas for positions at the Middle-level median is 60k and for Seniors - 75k.
Behind the "Not Relevant" label are either specialists that use multiple technologies in their every-day routine or Managers, Designers, QA, which are not bound to any fixed technology.
For example, the median yearly salary of a Google Cloud Engineer (light green boxplot) exceeds the salary of other engineers. The yearly salary of Java developers has a distribution centered around 70k/year with many deviations towards significantly higher salary values. The engineers using Python (the largest group) are paid around 70k/year, the salary distribution has the highest standard deviation, which tells about a wide span of salaries.
Among 817 respondents who live in Germany 509 specified their yearly Brutto salary for 2018 year. The above boxplots show distributions of:
In Germany the distribution of yearly salaries from 2015 is concentrated around 52k, 2016 - 60k.
2017, 2018, 2019 years distributions have a higher standard deviation, which may evidence a more diverse audience participated in the surveys. During the last three years, the peak of distribution constantly moves to the right -> the most frequent salary of respondents from Germany grows by 1-2k from 2017 until 2019.
The curve of 2019 is notably right-skewed -> it indicates more respondents, whose Brutto salaries are near or above 100k per year: 11% in 2019 and 6.2% in 2018. (In case of Brutto salaries + bonuses + stocks: 17.4% in 2019 and 9.6% in 2018.)
As in 2018, in 2019 salaries in Berlin and Munich are aligned again for the majority of respondents (424 from Berlin, 238 from Munich). The distribution peaks are 68k and 70k for Berlin and Munich respectively. Distribution for Munich is more right-skewed -> as a percentage in Munich more salaries in the range 100-200k/year than in Berlin, although in absolute terms there is almost the same number of such respondents (around 50). The Berlin distribution has a small bump at around 120k/year for respondents.
According to respondents, the common salary in Hamburg as of 2019 is lower than in the other 4 cities. Although in Frankfurt the average salary is around 84k, the most frequent salary is around 70k. The green curve corresponding to Amsterdam shows the highest frequent salaries in the range of 68-75k.
The salaries in Berlin and Munich are broadly similar.
The Senior-level salary distributions have the same medians: 75k in Berlin and in Munich. Their averages are around 77.5k in Berlin and 84k in Munich. 80% of Senior-level salaries are concentrated between 60–100k in Berlin. In Munich, there are 71% within that salary range and 19% of salaries are above 100k.
The Middle-level specialists in Berlin and in Munich get paid mostly up to 75k.
Thanks to Ilya Nikokoshev for valuable comments.
Thanks to Viktor Shcherban and Sergey Vasilyev for previous salary surveys and great datasets (2015, 2016, 2017, 2018)
Thanks to the Berlin Ru community for their support.
Thanks to everyone who filled out the salary survey form in 2019.
1. Overall dynamics over 2015 - 2019
In December 2019, 986 respondents filled out the salary survey. The survey has been conducted since 2015. Line charts below show the 5-year dynamics of the rising number of respondents along with their median salaries by years.In 2019 the number of respondents who participated in the salary survey has grown by 35% compared to 2018 and amounted to 950. Starting from around 200 responses in 2015 the audience is increasing steadily by an average of 53% each year.
Since 2015, the median salary has grown by 5k every year, except for 2018, when it remained the same as in 2017. Fortunately, in 2019, growth by 5k resumed.
From here all the charts below are based on clean data, which contains only European respondents in IT positions (5.3% responses excluded).
2. Age
55% of the respondents are between 29 and 35 years old. The common age range has become wider compared to 2018 (30-33 years) and 2017 (30-32 years).3. Gender
4. Cities & Countries
The audience is not limited to Germany but spreads across Europe.Respondents come from 70 cities from 20 countries from Europe and Asia.
- 15% reporters are from outside Germany
- 85% reporters are from Germany
4.1 Cities outside Germany
First, take a sneak peek at countries and cities of respondents outside Germany."Other cities" category unites cities with at most one respondent from Western or North Europe.
4.2 Cities in Germany
5. Language
5.1 Language per country
- 77% respondents working in Germany and Netherlands specified English as their main language at work.
- 100% respondents from Netherlands use English at work.
- 19% respondents speak German working in German companies. Some respondents work in Germany and use the Russian language at work as main.
In the consulting sector in Germany, employees speak mostly German, whereas in product companies and startups English is considered as the main language.
6. Home office days per month & Vacation days per year in Germany
A quarter of respondents from Germany have 4 home office days per month.Most respondents have 30 vacation days a year.
7. Salaries
7.1 Median salaries (EUR/year) of IT specialists in Germany
817 answers were received from respondents living in Germany, 20% of them filled out the company name: there are specialists from Google and Amazon, as well as from relatively small, not yet well-known startups.A quarter of German respondents work as Backend Developer, their median salary with bonuses is 70k/year. Positions with less than 5 responses are not presented.
7.2 Salary (EUR/year) vs Total experience (Years) in Germany
43 different job titles appear in the responses. The above scatter plot is built only based on Developer, Engineer (including ML), Data Scientist, and Architect positions (Dev&Tech) in Germany excluding Designers, Managers, QA, DevOps, and others.
Note that the scatter plot is based on Brutto salaries without bonuses and stocks. The median salary of all Dev&Tech positions is 70k, whereas for positions at the Middle-level median is 60k and for Seniors - 75k.
7.3 Salary (EUR/year) vs Technology
7.3.1 Shares of respondents by technologies
The most common programming language among respondents is Python, the second most - Java.
Behind the "Not Relevant" label are either specialists that use multiple technologies in their every-day routine or Managers, Designers, QA, which are not bound to any fixed technology.
7.3.2 Salary (EUR/year) vs Technology
25 technologies & programming languages were selected as the main technology by 934 respondents. 25 box plots represent Brutto salary distributions of specialists by technologies.
For example, the median yearly salary of a Google Cloud Engineer (light green boxplot) exceeds the salary of other engineers. The yearly salary of Java developers has a distribution centered around 70k/year with many deviations towards significantly higher salary values. The engineers using Python (the largest group) are paid around 70k/year, the salary distribution has the highest standard deviation, which tells about a wide span of salaries.
7.4 Distribution of salaries with and without bonuses and stocks in Germany
Among 817 respondents who live in Germany 509 specified their yearly Brutto salary for 2018 year. The above boxplots show distributions of:
- yearly Brutto salaries with bonuses and stocks
- yearly Brutto salaries with bonuses
- yearly Brutto salaries
- Median yearly Brutto salary has increased by 5k since last year and became 70k.
- The same shift in 5k is in yearly Brutto salaries with bonuses from 2018 to 2019 66k -> 71k.
- Median yearly Brutto salary with bonuses and stocks has raised from 66k to 72.
7.5 Brutto salaries in Germany over 2015 - 2019
In Germany the distribution of yearly salaries from 2015 is concentrated around 52k, 2016 - 60k.
2017, 2018, 2019 years distributions have a higher standard deviation, which may evidence a more diverse audience participated in the surveys. During the last three years, the peak of distribution constantly moves to the right -> the most frequent salary of respondents from Germany grows by 1-2k from 2017 until 2019.
The curve of 2019 is notably right-skewed -> it indicates more respondents, whose Brutto salaries are near or above 100k per year: 11% in 2019 and 6.2% in 2018. (In case of Brutto salaries + bonuses + stocks: 17.4% in 2019 and 9.6% in 2018.)
7.6 Brutto salaries + bonuses in the most represented cities of 2019 survey
As in 2018, in 2019 salaries in Berlin and Munich are aligned again for the majority of respondents (424 from Berlin, 238 from Munich). The distribution peaks are 68k and 70k for Berlin and Munich respectively. Distribution for Munich is more right-skewed -> as a percentage in Munich more salaries in the range 100-200k/year than in Berlin, although in absolute terms there is almost the same number of such respondents (around 50). The Berlin distribution has a small bump at around 120k/year for respondents.
According to respondents, the common salary in Hamburg as of 2019 is lower than in the other 4 cities. Although in Frankfurt the average salary is around 84k, the most frequent salary is around 70k. The green curve corresponding to Amsterdam shows the highest frequent salaries in the range of 68-75k.
7.7 Middles vs. Seniors salaries+bonuses / Berlin vs. Munich
The salaries in Berlin and Munich are broadly similar.
The Senior-level salary distributions have the same medians: 75k in Berlin and in Munich. Their averages are around 77.5k in Berlin and 84k in Munich. 80% of Senior-level salaries are concentrated between 60–100k in Berlin. In Munich, there are 71% within that salary range and 19% of salaries are above 100k.
The Middle-level specialists in Berlin and in Munich get paid mostly up to 75k.
Credits
Thanks to Andrey Zolotin for the inspiring interactive visualization of survey data with D3.js and collecting of responses to the salary survey 2019.Thanks to Ilya Nikokoshev for valuable comments.
Thanks to Viktor Shcherban and Sergey Vasilyev for previous salary surveys and great datasets (2015, 2016, 2017, 2018)
Thanks to the Berlin Ru community for their support.